i-Analyzer: AI-Powered Non-Linear Correlation Analysis and Process Capability Visualization
i-Analyzer is a fully browser-based quality data analysis software providing intelligent analytical functions.
It smartly manages the massive volumes of inspection and measurement data generated in mass production processes. The software performs comprehensive pass/fail evaluations of inspection characteristics based on various criteria, including process capability, control chart stability, and out-of-tolerance data. By unifying evaluation standards, i-Analyzer ensures that calculation results remsain consistent across all users.
The platform is equipped with essential tools for efficient high-volume data management, such as stratified displays, data sorting by control numbers, and control charts with programmable trend management.
Browser-Based Architecture
A key feature of i-Analyzer is its ability to perform data analysis directly within a web browser. Traditional desktop applications require individual distribution, installation, and uninstallation for each PC, which creates significant overhead when managing numerous client terminals. The iNDEQS series solves this problem by adopting Google Chrome and Microsoft Edge as its standard interfaces.
Since i-Analyzer deployment and updates are completed entirely on the server side, there is no need to manage different software versions or support individual terminal updates. This significantly reduces administrative burden compared to desktop apps.
The system is scalable, supporting everything from standalone small-scale setups to large-scale enterprise systems across on-premise and cloud servers.
ISO 22514-2 Compliance: Reliable AI-Assisted Process Capability
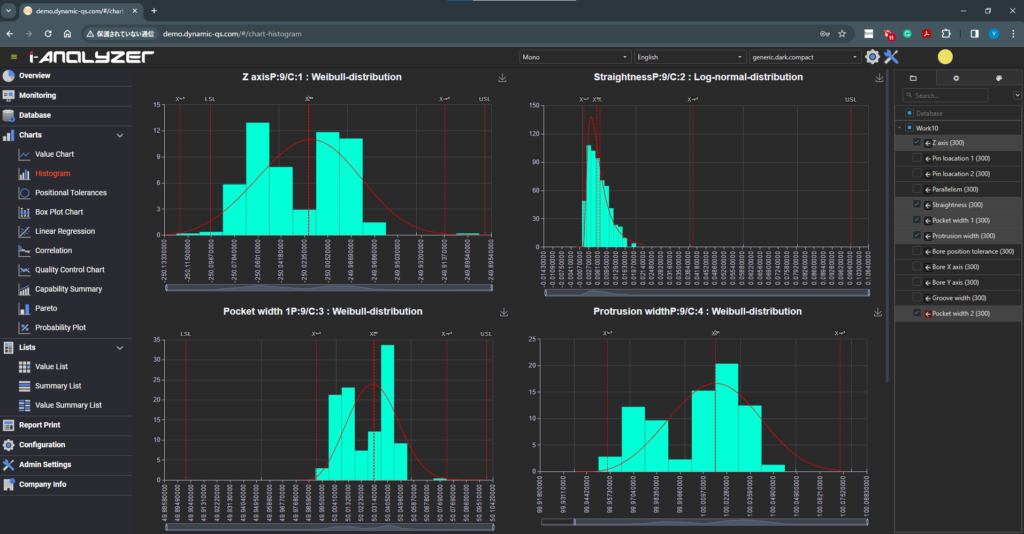
i-Analyzer utilizes the percentile method in compliance with ISO 22514-4 to calculate highly reliable process capability (Cp/Cpk) indices.
Since manufacturers are accountable to their customers for how process capability is calculated, we ensure our methodology is never a "black box." Our proprietary technology selects the optimal distribution curve by combining AI with advanced algorithms. This technology allows accurate process capability calculations even with small datasets and ensures consistent results regardless of who performs the analysis, eliminating human subjectivity.
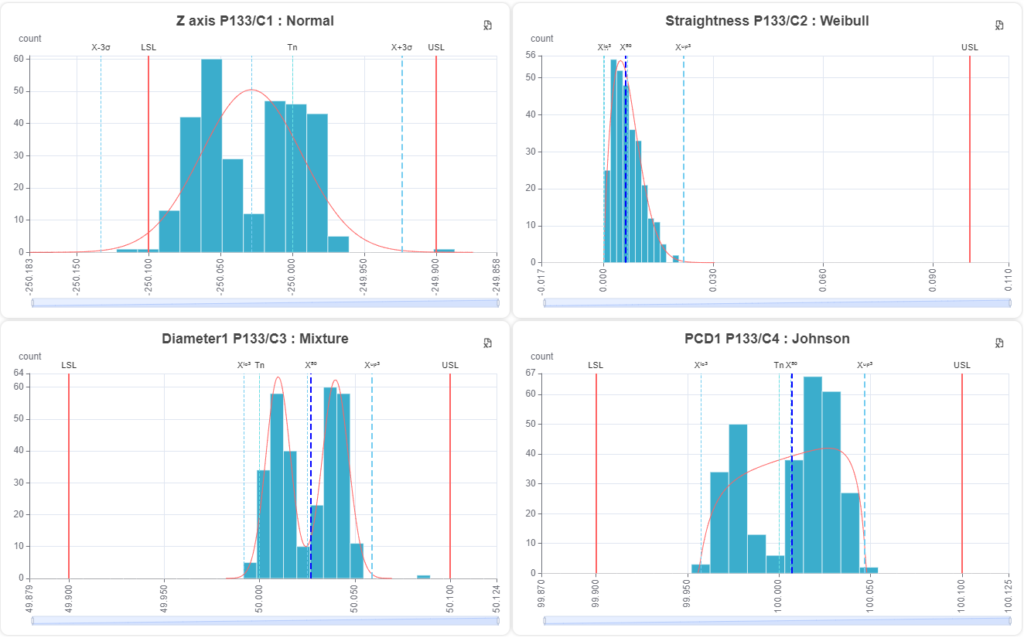
Chart Split: A 5M Analysis Tool Supporting IATF 16949 9.1.1.1
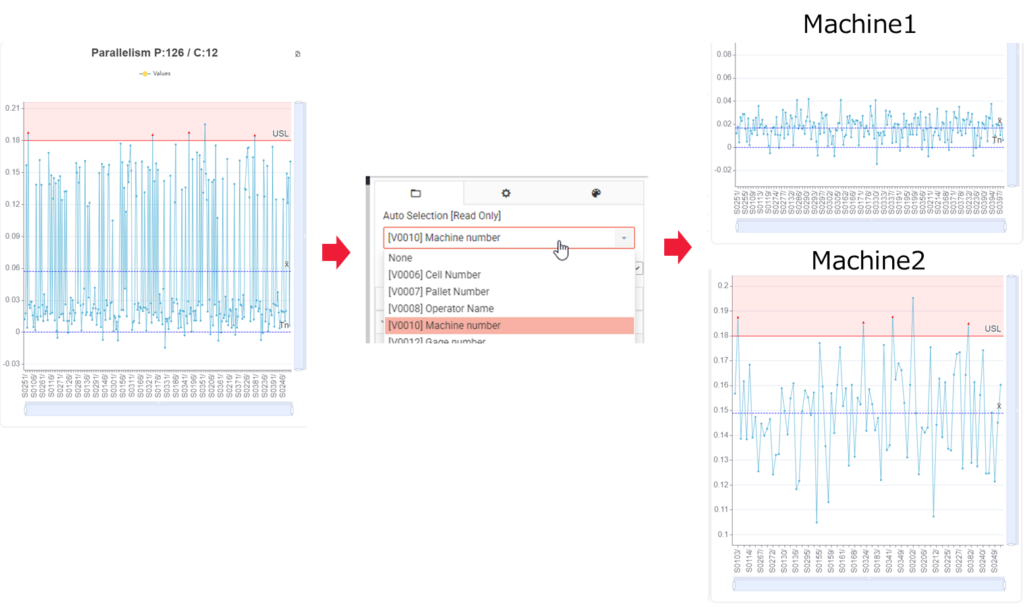
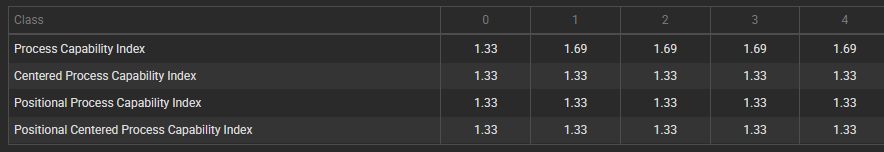
The i-Analyzer data structure is optimized for analysis based on the 5M factors of process variation (Man, Machine, Method, Material, and Milieu). As shown below, using the "Split" function on a characteristic graph (e.g., by machine number) automatically segments the data and recalculates process capability indices for eachfactor.
Compliance with IATF 16949 8.5.2.1: Identification and Traceability — Supplemental
Clause 8.5.2.1 requires the retention of records such as:
- Production date
- Batch/Lot information
- Operator name
- Equipment/Machine number
- Measurement instrument number
- Process records
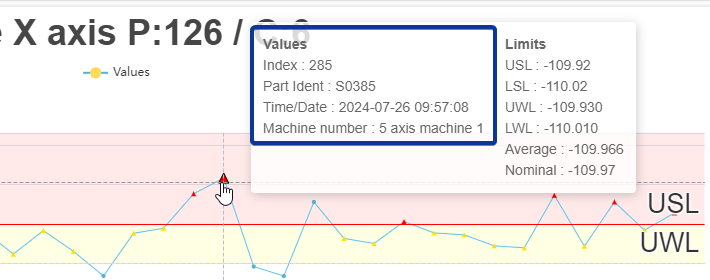
iNDEQS links measurement and inspection values directly with this traceability information. In i-Analyzer, simply hovering over a data point on a graph triggers a pop-up window displaying all linked metadata, such as time, Product ID (serial/lot number), and equipment information. This window is customizable, allowing users to select only the information relevant to their specific operations. By centralizing this data, users can immediately verify traceability information directly from the graphs they monitor daily the moment an anomaly is detected.
Advanced Data Comparison Features
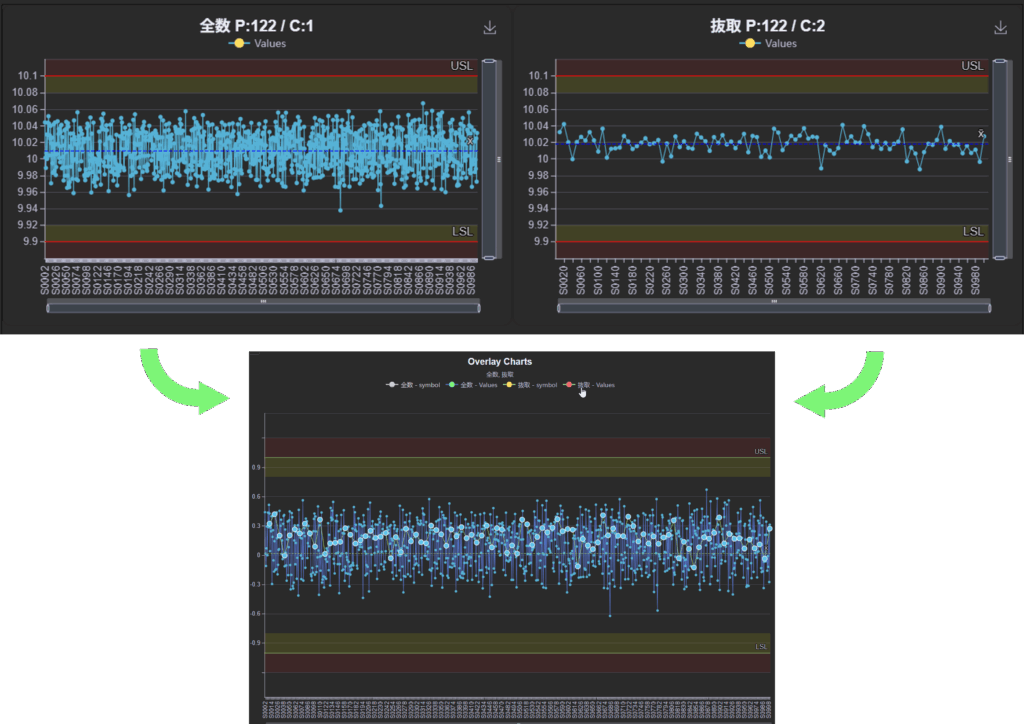
i-Analyzer implements specialized functions for quality data comparison. For example, it can align and compare data of different granularities. This allows for the direct comparison of sampling inspection data against 100% inspection data by aligning them by serial number, regardless of inspection order or time.
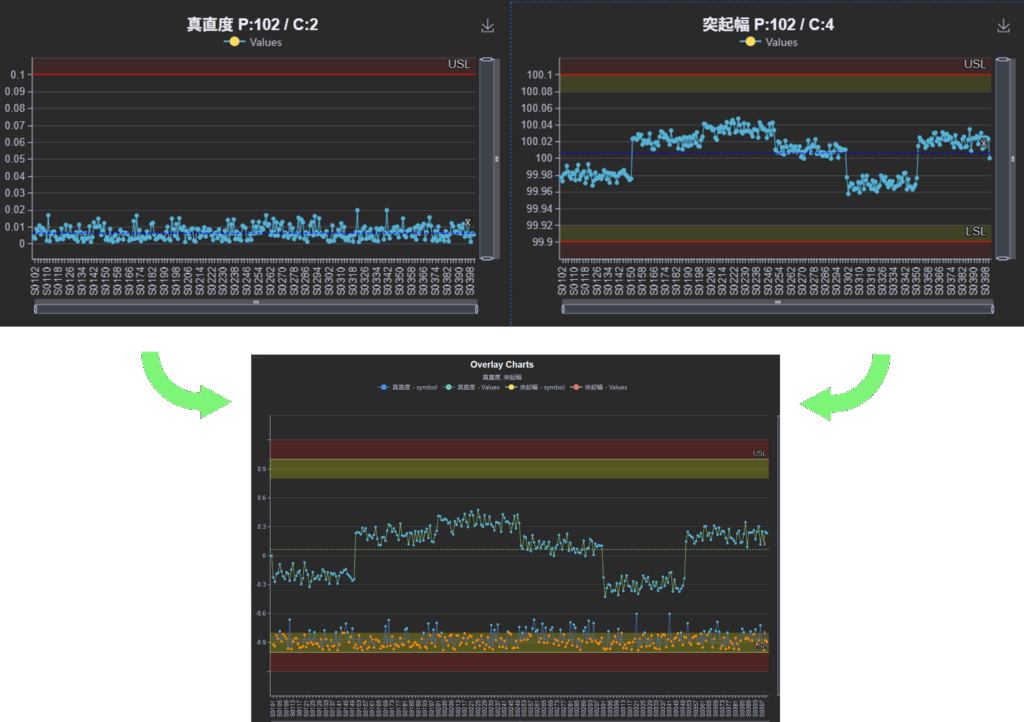
Additionally, data can be normalized using Z-scores or specification widths, enabling the comparison of two different characteristics with different absolute values on the same scale.
Event Input Function
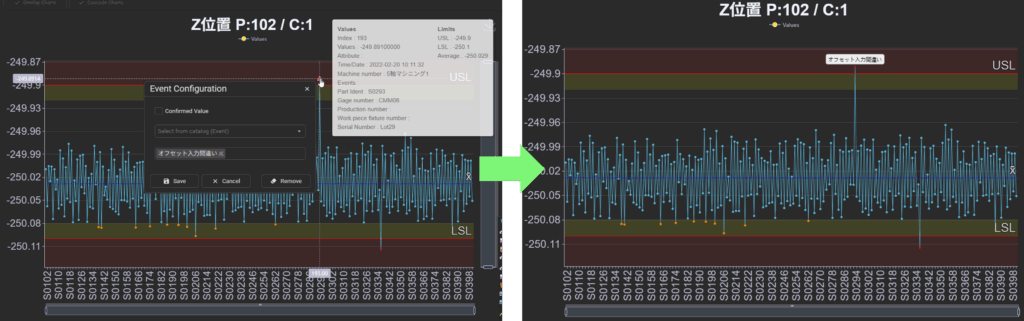
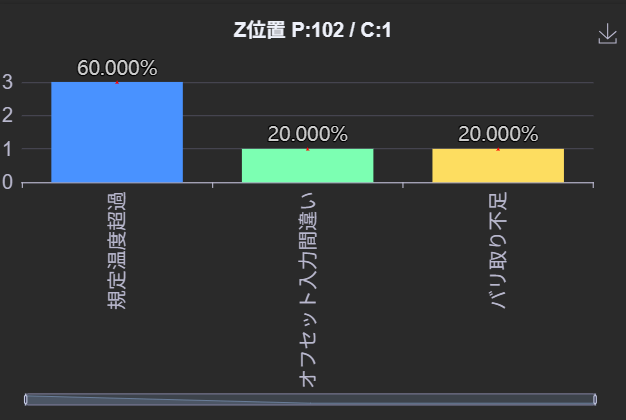
Users can record "events" directly onto specific data points on the graph. These entries are immediately reflected in the database and shared with the entire team. By using this feature to record defect causes or countermeasure instructions, production and quality departments can communicate with unprecedented speed.
Recorded events are aggregated and can be visualized using Pareto charts.
Advanced Filtering Capabilities
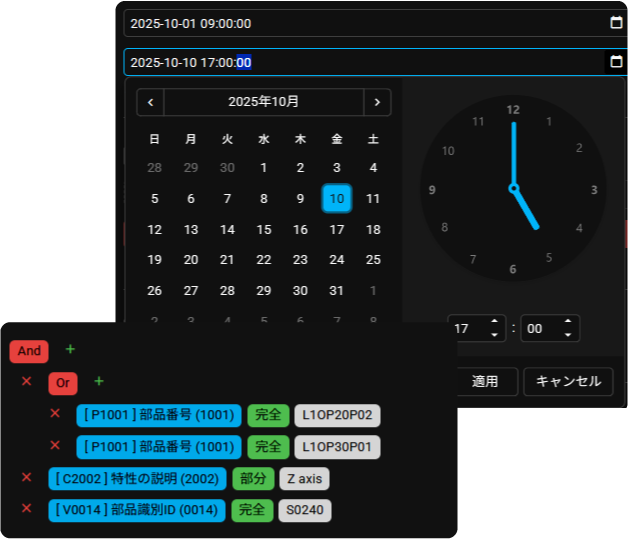
i-Analyzer features a powerful, no-code filtering system. Users can combine various product information (part numbers, characteristic names, serial numbers) and time-based criteria to isolate specific data sets.
Filters are saved individually for each user, and multiple sets of conditions can be stored. Once a condition is registered, the desired data can be extracted with a single click.
Comprehensive Quality Charts
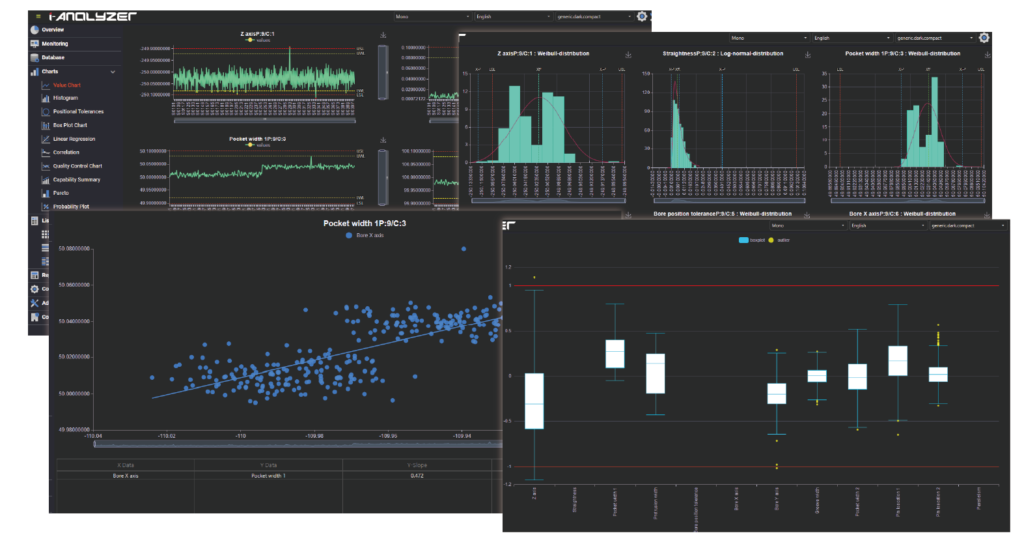
i-Analyzer provides all the essential charts required for quality assurance, including line graphs, histograms, control charts, box plots, and scatter plots. Users can freely customize the number of charts displayed, as well as their size and color. Scaling and scrolling functions offer an intuitive experience comparable to high-performance desktop applications.
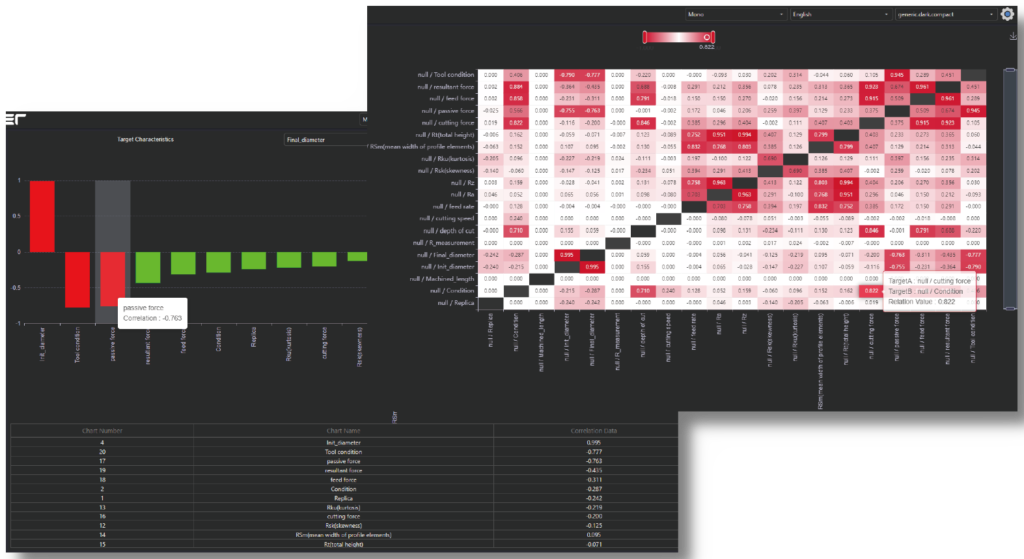
Correlation Diagrams
Correlation between characteristics can be visualized in two ways depending on the objective:
- Heat Map: Displays an overview of correlations across all characteristics. The strength and direction (positive/negative) of correlations are instantly identifiable by color.
- Bar Chart: Compares a specific characteristic against others, ranking them from strongest to weakest correlation. Users can filter to see only the Top 10 or Top 5 influencers.
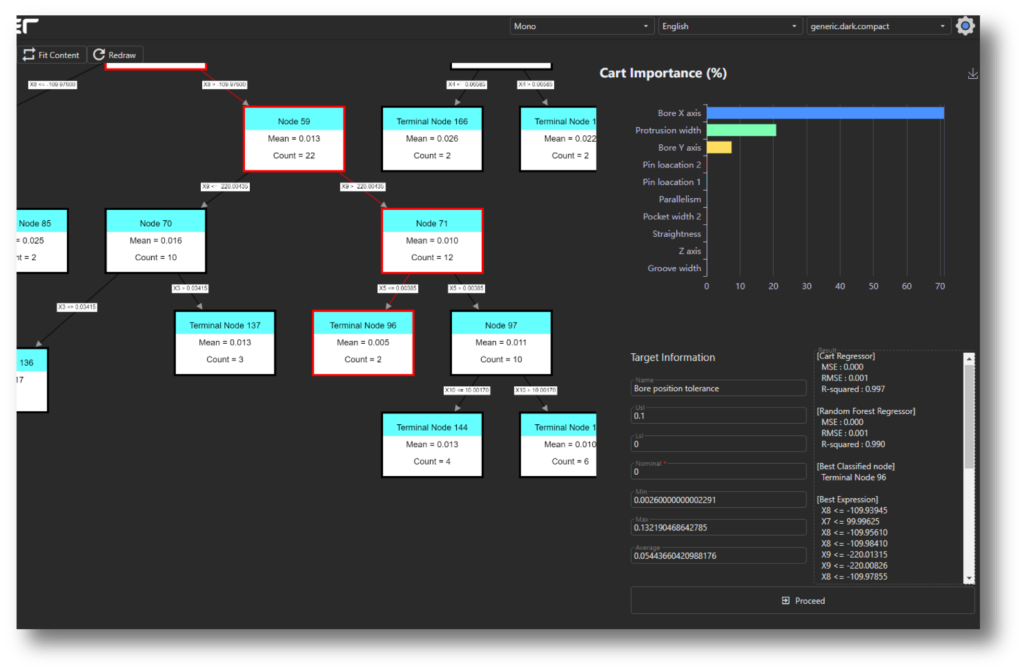
AI-Driven Production Parameter Impact Analysis
It is rare for a part to be completed on a single process; most pass through multiple stages and machines. Countless variables—such as feed rate, spindle speed, temperature, tool wear, and coolant flow—affect equipment behavior. The final quality of a product is the culmination of these production factors. By treating these factors as explanatory variables and quality results as the objective variable, our AI identifies which factors have the greatest impact on quality, enabling rapid identification of production challenges and improvement points.
Effective for IATF 16949 9.1.1.3: Systematic Evaluation Strategies to Eliminate On-Site Ambiguity
While IATF 16949 9.1.1.3 requires operators to interpret process conditions from statistical data and plan countermeasures, consistent implementation is often difficult.
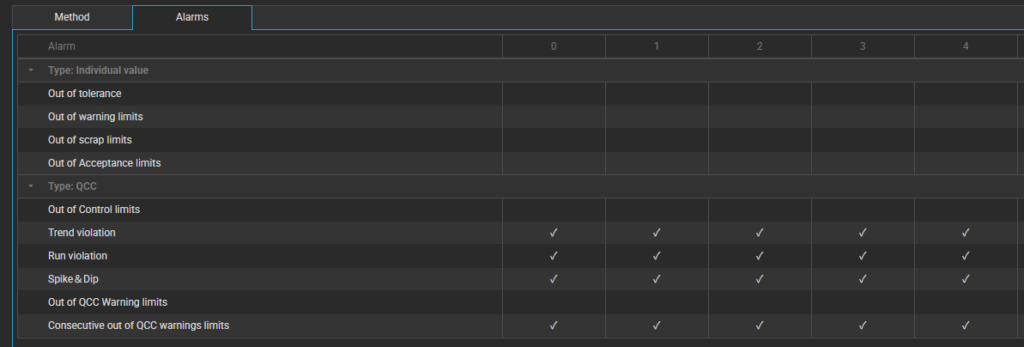
i-Analyzer addresses this by implementing "Evaluation Strategies" that allow process capability standards and control chart anomaly detection to be configured based on data importance. Multiple strategies can be defined to provide flexibility across different processes.
Quality managers with expertise in statistics can define these strategies, while on-site operators simply follow pre-defined internal rules for each alarm type. This creates a systematic response to process anomalies and minimizes gaps in response caused by varying levels of statistical knowledge among staff.
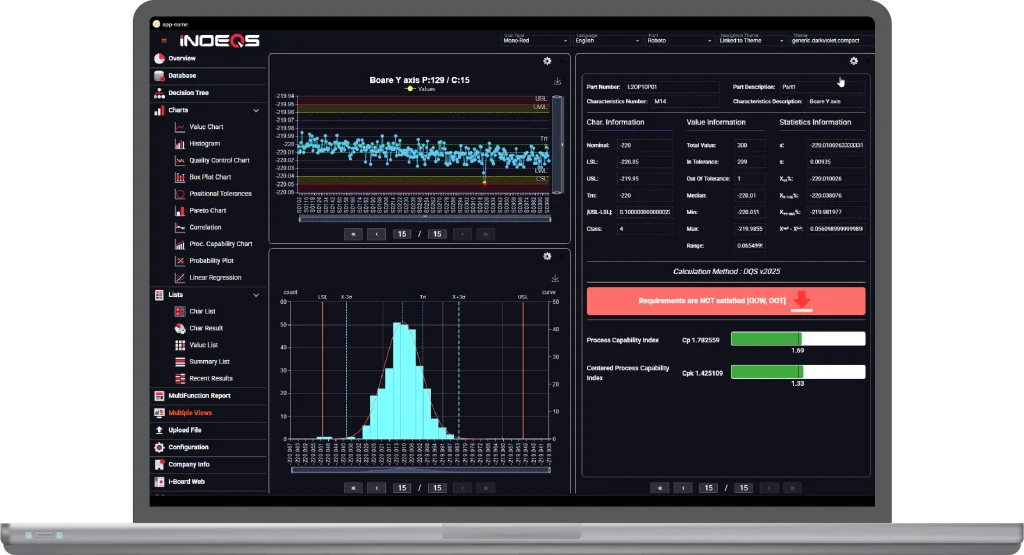
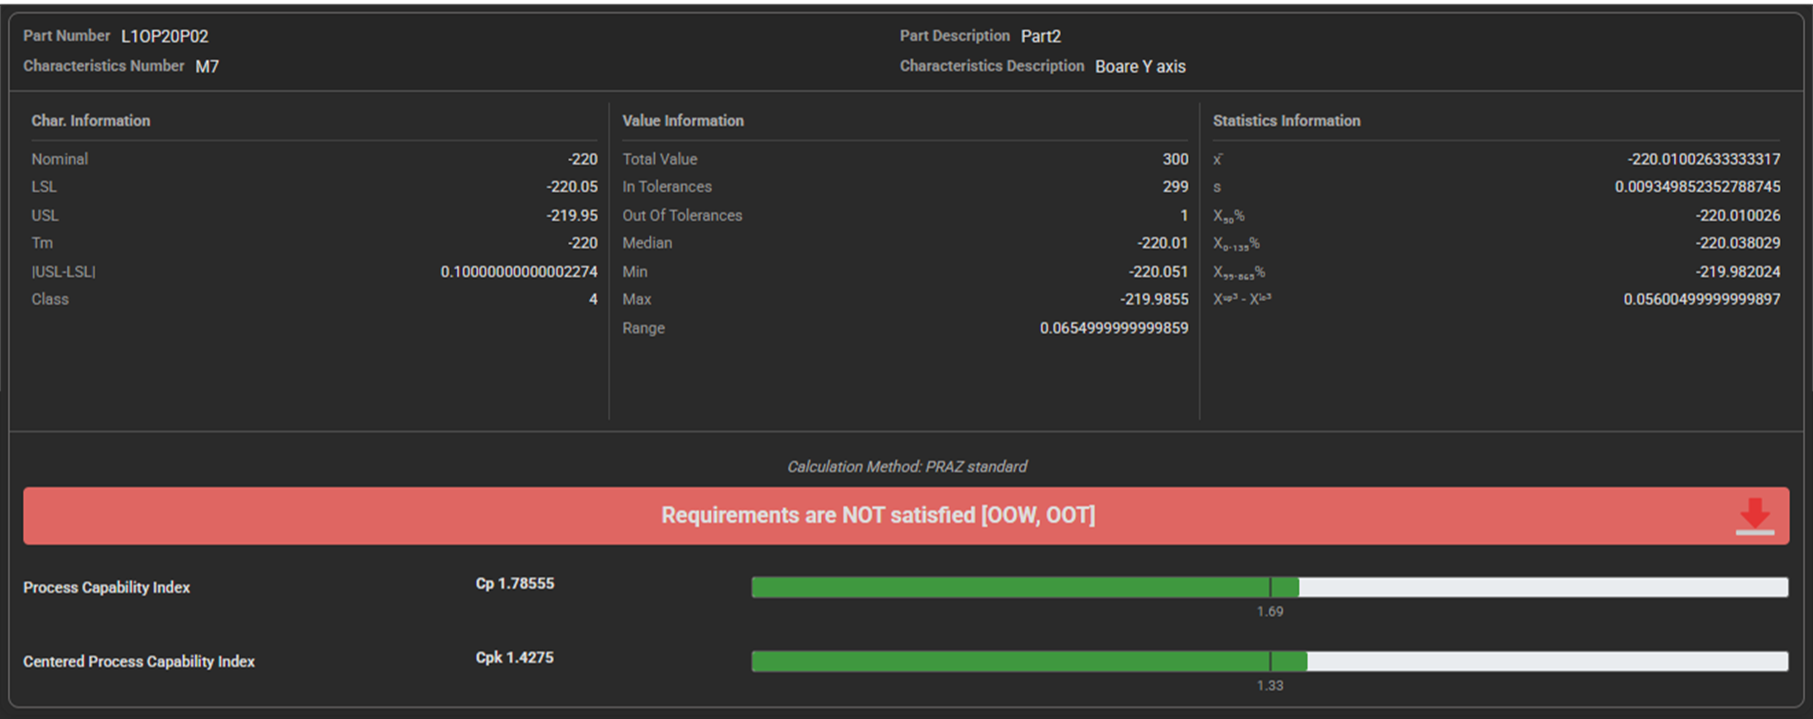
iNDEQS displays evaluation results alongside statistical information. The layout is categorized logically to follow actual process management:
- Left: Design information (tolerances, specifications).
- Center: Current status (actual totals, max/min, mean).
- Right: Prediction (process capability evaluation, statistical analysis).
Furthermore, evaluation results do not just show a simple pass/fail; they are designed to show exactly why a characteristic failed (e.g., insufficient capability, out of tolerance, or within the warning zone) at a glance.
Click the button below to play the i-Analyzer introduction movie.
i-Analyzer FAQ (Frequently Asked Questions)
-
Is the license a one-time purchase or a subscription?
-
We offer both plans. The subscription includes maintenance fees and ensures you always have access to the latest version. For one-time purchases (perpetual licenses), you can also access the latest updates by signing a maintenance contract. If you plan to use the software for more than four years, the one-time purchase offers a cost advantage in terms of Total Cost of Ownership (initial cost + operating costs).
-
Are there discounts for purchasing multiple licenses?
-
We offer tiered discounts for purchases of three or more licenses. For orders of 20 or more, a cost-effective corporate license is available. Please contact us via the inquiry form for more details.
-
Does iNDEQS support cloud or on-premise servers?
-
While iNDEQS uses a web browser as its user interface, it is compatible with both cloud and on-premise (in-house server) environments.
-
Can iNDEQS be used on a standard PC?
-
All iNDEQS software components can be installed on a single PC. For small-scale data processing, a standard PC* will perform sufficiently well.
*Note: A high-spec PC may be required when using optional AI add-on modules.
-
Is data sent externally when performing AI analysis?
-
No. iNDEQS utilizes AI that operates entirely within your local environment. Since the pre-trained local AI performs the analysis, no data is transmitted to external cloud services. This allows you to securely handle highly confidential design values and tolerance information without an internet connection.
-
What specifically is the process capability calculation based on ISO 22514-2?
-
Instead of traditional 3 sigma calculations (which assume a normal distribution), iNDEQS automatically determines the data's distribution shape (e.g., Weibull or log-normal). It then calculates process capability by deriving quantile values (0.135% and 99.865%) from the optimal distribution model. This enables highly accurate defect rate predictions regardless of the user's level of statistical expertise.
-
What kind of data can be imported?
-
As long as the data has a "consistent structure," almost any format can be imported, including Excel, CSV, JSON, and text data from measuring instruments. However, files must be converted to a specific format; the system supports DFQ (ISO-compliant) or JSON. While we provide conversion software (i-FLEX), the data specifications are open, allowing users to develop their own custom conversion programs.
-
Can handwritten data be imported?
-
Converting analog data to digital form presents more challenges than converting digital-to-digital. However, with modern high-performance OCR and tablet PCs, there are various solutions available. Please reach out to us, and we will propose a method tailored to your workflow.
-
Do I need specialized statistical knowledge for operation?
-
i-Analyzer is specifically designed for quality control data. Most analyses, such as process capability evaluations and trend detection in control charts, are automated. While basic statistical knowledge to interpret graphs is necessary, specialized expertise is not required.
-
How does this differ from analysis using Excel or general BI tools?
-
There are three main differences:
- Optimized Design: Since the software is architected specifically for quality data, it processes diverse and large volumes of data significantly faster than general-purpose tools.
- ISO Compliance: Because the methods for calculating process capability and judging process quality align with international ISO standards, your ability to meet IATF 16949 audit requirements is greatly enhanced.
- Automation: Everything from data collection to stratified analysis of the "5M" factors (Man, Machine, Method, Material, Milieu) can be automated. This minimizes the time spent "getting results," allowing you to focus more on planning and implementing improvements.