

Digital Quality Strategy: Automating IATF 16949 SPC Requirements for Practical Implementation
Bridging the gap between daily quality monitoring and audit evidence.
The Increasing Complexity of SPC Core Tool Requirements
IATF 16949 defines five core tools:
| APQP | Advanced Product Quality Planning |
| PPAP | Production Part Approval Process |
| FMEA | Failure Mode and Effects Analysis |
| MSA | Measurement Systems Analysis |
| SPC | Statistical Process Control |
Among these, SPC requirements are becoming increasingly sophisticated as information is digitalized. While many explanatory sites detail "What" to monitor in terms of statistics, very few explain the "How"—the concrete steps for implementation. It is often simply stated to "use spreadsheets or SPC software," but the requirements are not so simple that they can be met just by knowing what to do. This page provides specific strategies for IATF 16949 Clauses 9.1.1.1, 9.1.1.3, and 8.5.2.1, which are deeply related to SPC.
ATF 16949 9.1.1.1: Requirements for Monitoring and Measurement of Manufacturing
1. Calculation of Process Capability (Cp/Cpk)
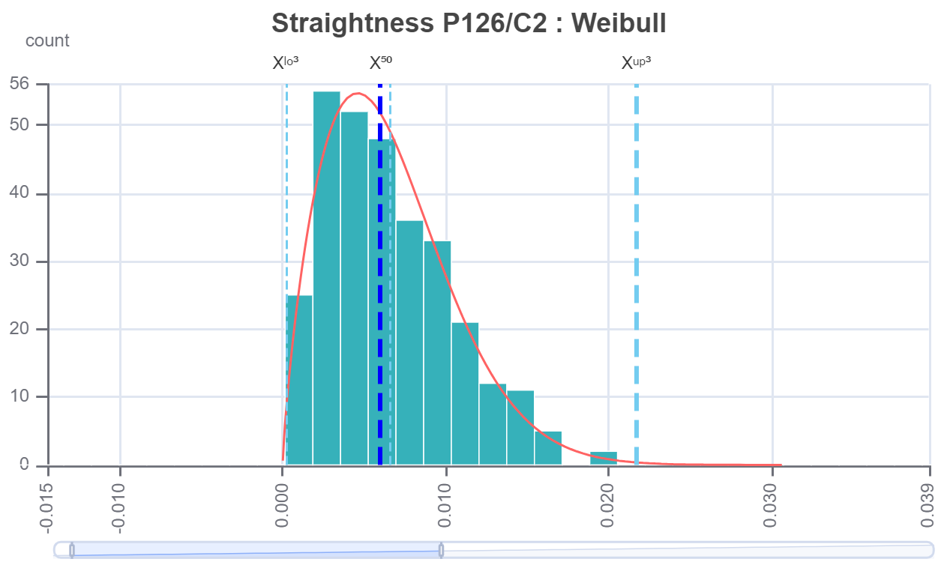
Non-normal distribution
Correct calculation is essential for process capability to be meaningful. It is not enough to simply apply a normal distribution and calculate capability based on ±3σ. While ISO 22514-4 defines the methods for Cp/Cpk calculation, using the percentile method correctly requires advanced mathematical knowledge. The common method of "dividing tolerance by 6σ" is only valid for normal distributions. In practice, only a few percent of characteristics maintain a normal distribution over long periods, making the percentile method indispensable.
Choosing the right distribution model is a matter of delicate balance:
- If the model doesn't fit the data, predictions will deviate significantly from reality.
- If the model overfits the data, reproducibility decreases.
Selecting the appropriate distribution curve manually is nearly impossible due to the complex calculations required. iNDEQS includes an AI-powered distribution curve selection module that automatically identifies the optimal model.
Click here for more on i-Analyzer’s AI-assisted Cp/Cpk calculation, fully compliant with ISO 22514-4.
2. Monitoring and Measuring Processes with Xbar-R Charts
Abnormal signs in control charts go beyond just exceeding control limits; they include "runs" (consecutive points above or below the centerline) and "trends" (consecutive points rising or falling). When using Excel, you must find these signs manually. While BI tools can easily draw the charts, you must build your own logic to detect abnormal patterns.
Especially with automotive parts, where management items are numerous, it is extremely difficult to verify all patterns within time constraints using general analysis software.
Click here for automatic instability pattern detection using i-Board.
3. Recording Events such as Repairs and Equipment Changes
Recording events like machine repairs or jig changes is mandatory, as these records are vital for root cause analysis of quality issues.
Process variations are generally categorized into the 5M (Man, Machine, Method, Material, Milieu). To perform a statistical investigation, one must have a dataset that allows analysis of whether "statistically significant differences" occur when the data are split by equipment or operator. The iNDEQS data structure is optimized for 5M analysis, enabling data splitting and instant comparison of process capability across different conditions.
Click here for the "Auto-Split" function in i-Analyzer, essential for 5M analysis.
IATF 16949 8.5.2.1: Identification and Traceability — Supplemental Requirements
In the manufacturing process, records of production dates, lots, operators, and equipment numbers must be kept and provided to customers or authorities within a specified timeframe (e.g., 24 hours) upon request. By centralizing this information as an extension of daily operations, you can eliminate the need to scramble through archives just to provide requested information.
Click here for the i-Analyzer pop-up window explaining centralized information display.
IATF16949 9.1.1.3: Application of statistical concepts
This clause requires understanding statistical concepts, interpreting process conditions, and planning countermeasures from statistical information. While classroom learning covers the basics of control charts and histograms, the ability to read actual quality conditions varies greatly by experience.
iNDEQS allows all team members to share the "Anomaly Judgment Criteria" established by veteran quality managers, ensuring consistent judgment regardless of individual knowledge levels. New employees can learn to interpret statistical data through the charts and reports of iNDEQS without disrupting their daily work.
Click here for the "Evaluation Strategy" sharing method in i-Analyzer.
Stop Managing for Audits. Start Managing for the Future.
Driven by CATENA-X and global data initiatives, the strategic importance of digital quality intelligence is soaring. Quality data is no longer just a record—it is your ticket to the global supply chain.
We offer expert consultations on building an IATF 16949-compliant data infrastructure that stands up to the toughest audits and global requirements.