i-Board Web: Automating Fixed-Point Observation via Anomaly Prediction Alarms in Automotive Part Processes
Monitoring critical information is the key to realizing process stability. However, finding noteworthy process issues from massive data that constantly changes takes a lot of work. i-Board is a quality dashboard with fast response, and quick data extraction functions that update the essential information quality managers require.
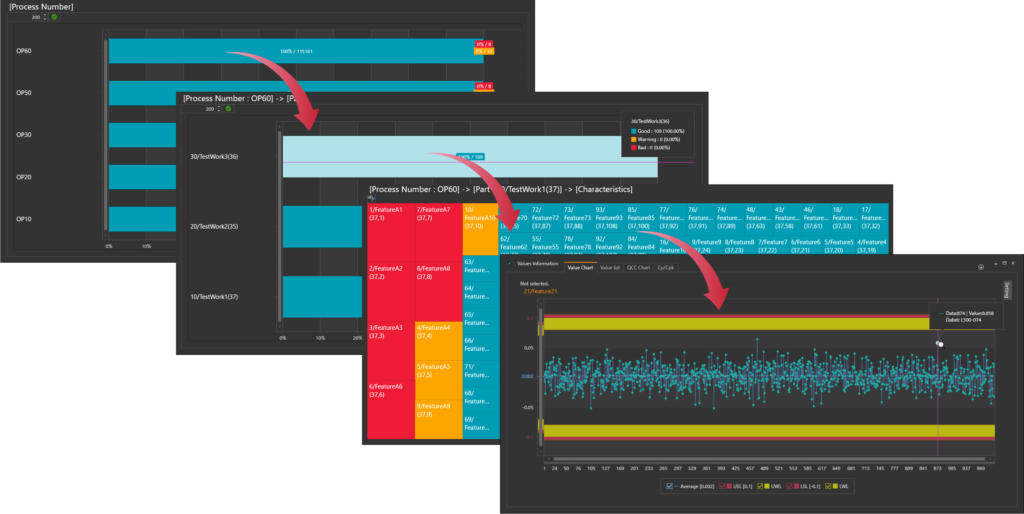
Drill-down function
i-Board provides a smart data drill-down function.
First, you can start drill-down from a high-level perspective, such as "by line," "by process number," or any categories you choose in the software setting.
Second, clicking on a specific bar graph will give you a more detailed level, such as "Parts" or "Characteristics."
Lastly, you can access the set of data you are searching for.
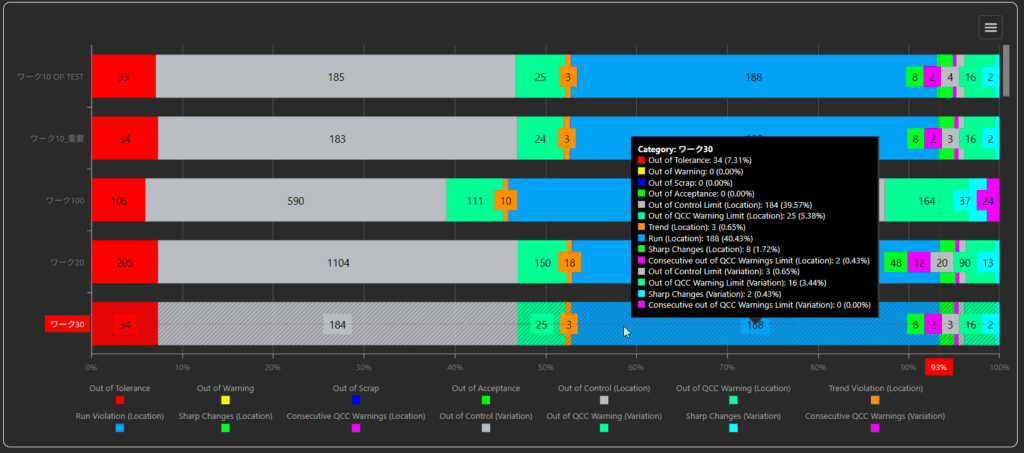
Automated Trend Monitoring
In mass production lines, specific patterns or signs often appear before out-of-tolerance data occurs. i-Board monitors these specific data change patterns and displays real-time alerts.
The i-Board dashboard aggregates the occurrence count of each trend type by process and characteristic over a set period, updating the status in real time. This allows you to instantly identify the characteristics that require immediate attention among numerous inspection items, eliminating the need to manually "search for problems."
Instability Patterns
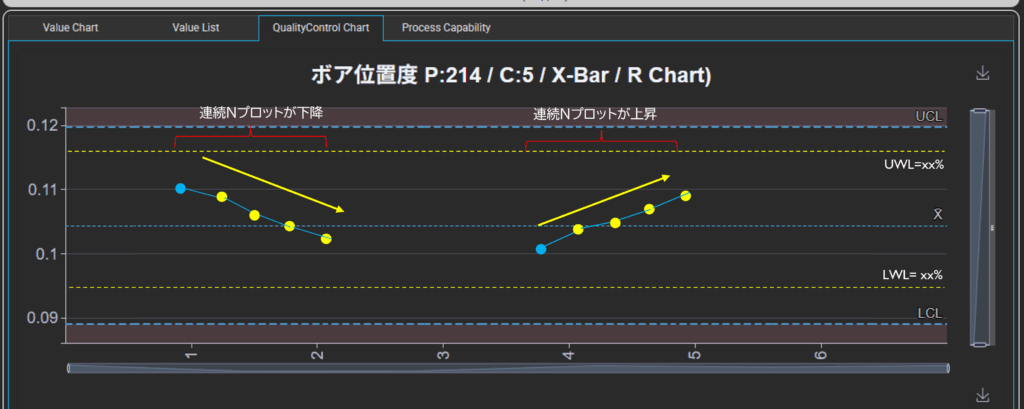
Trend:
Detects a state where a specified number of consecutive plots on the control chart show a consistent directional movement (upward or downward).
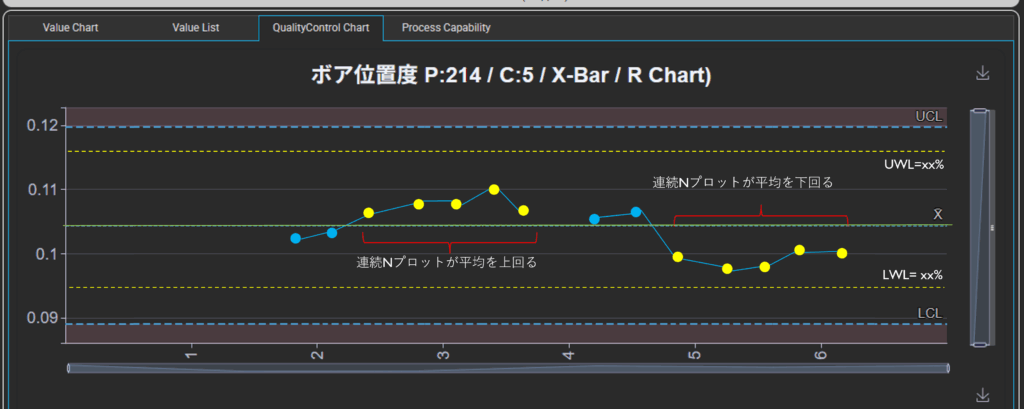
Run:
Detects a state where a specified number of consecutive plots on the control chart remain consistently above or below the average line (center line).
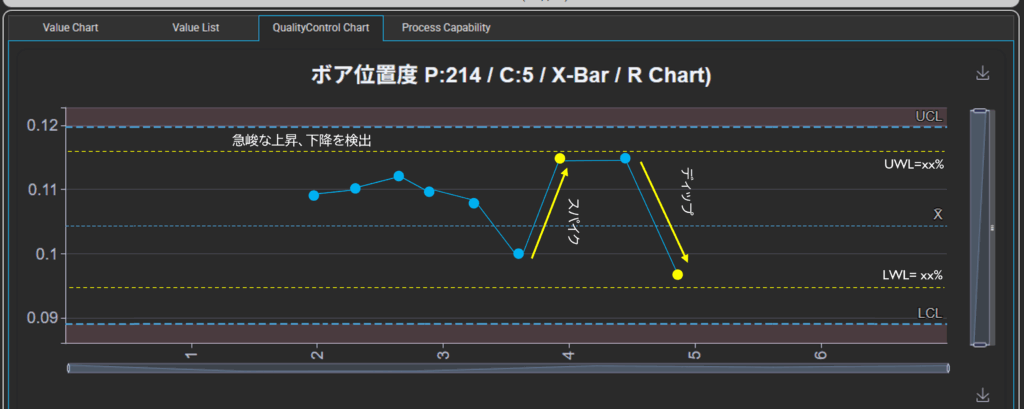
Spike & Dip:
Detects steep changes of ±n% or more relative to the previous value, where the total distance between the Upper Control Limit (UCL) and Lower Control Limit (LCL) is defined as 100%.
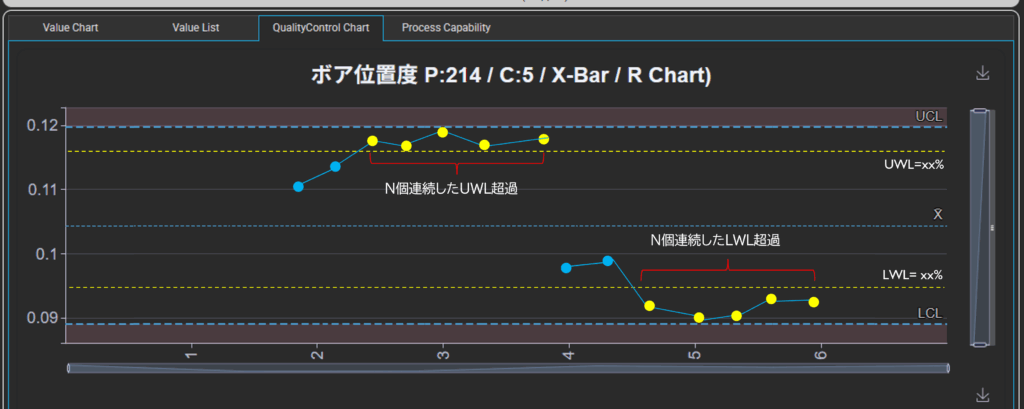
Warning Zone Run:
Detects patterns where a specified number of consecutive values fall within the "Warning Zone" (defined as a tolerance utilization rate of n% or more of the UCL/LCL).
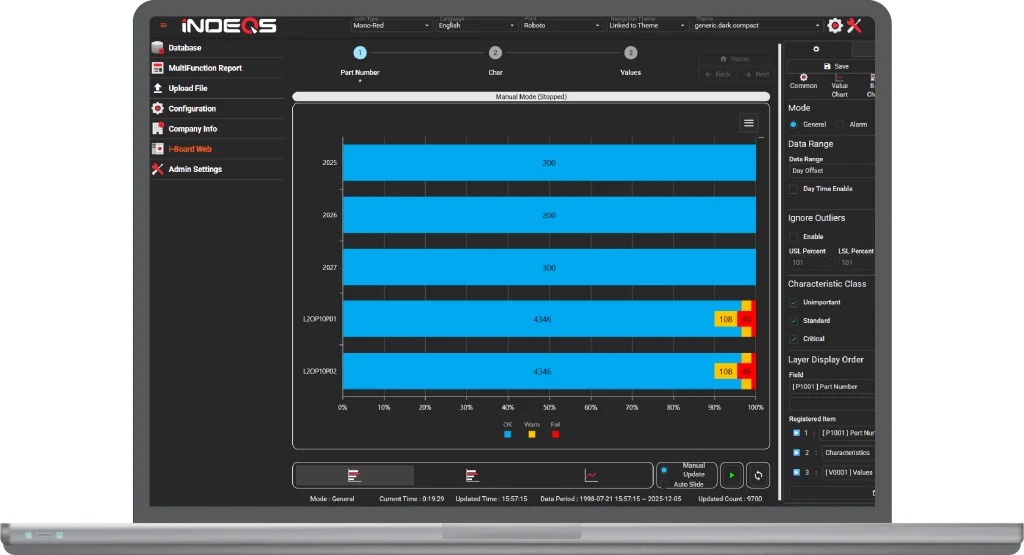
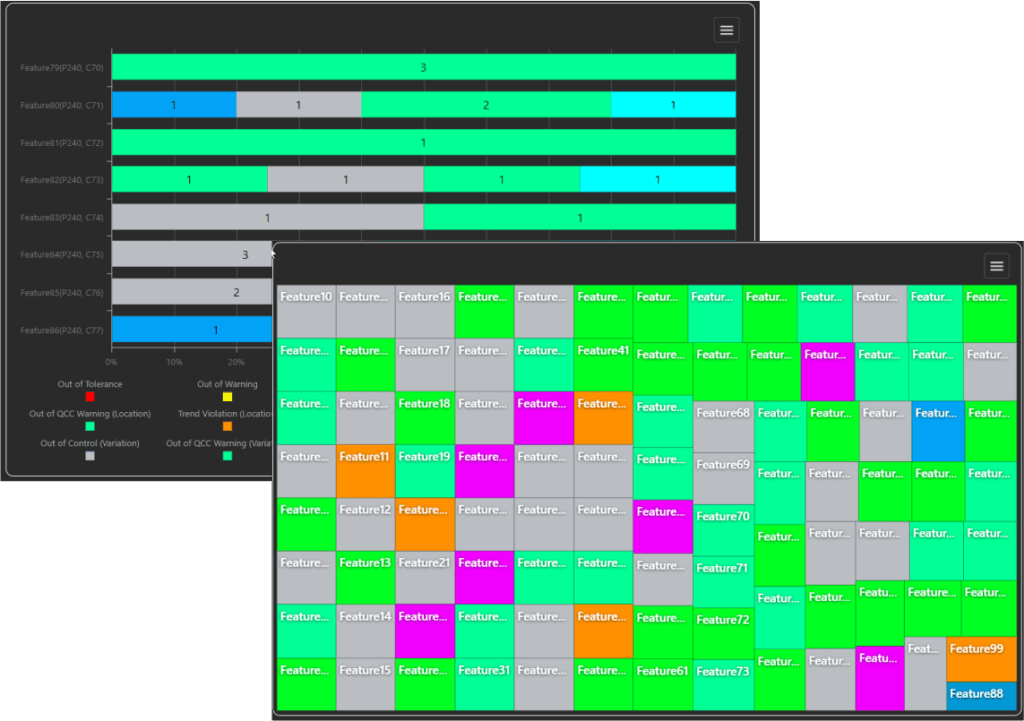
Bar Charts and Treemaps
You can choose between Bar Charts and Treemaps as the visualization format, depending on your specific needs.
- Bar Chart Mode: While the number of graphs per page is limited, it allows you to clearly identify all triggered alerts by color at a glance.
- Treemap Mode: This mode is ideal for monitoring a vast number of characteristics simultaneously on a single screen.
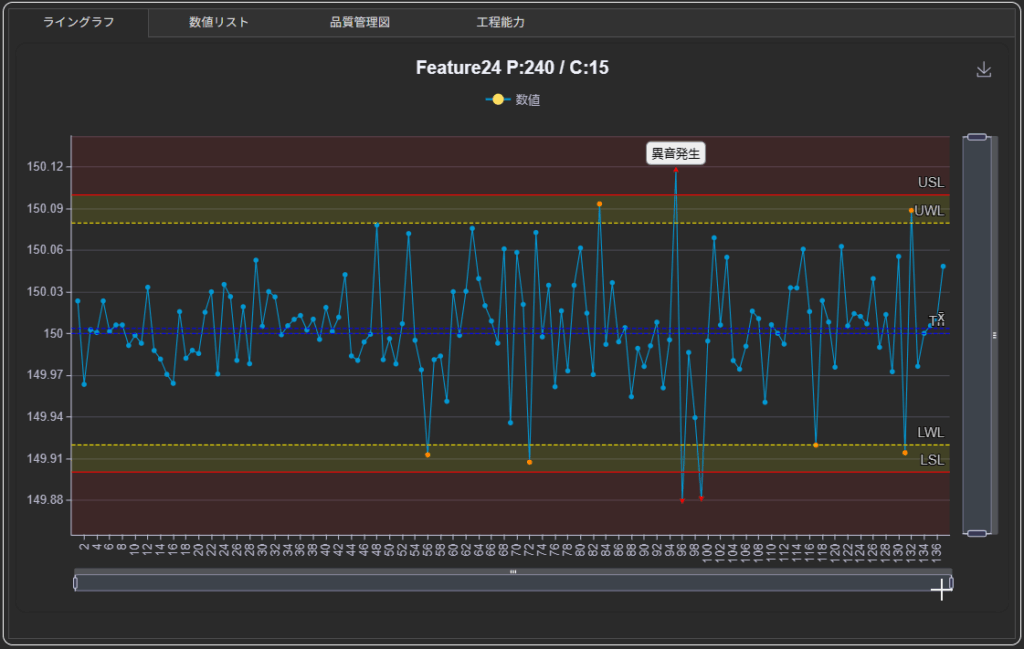
Event Logging and Display Function
The i-Board interface allows you to log "event information" directly onto the graphs. When out-of-tolerance data or anomalies occur, you can save event details alongside the specific data points, making it easy to record exactly when and what happened. These logged events can be aggregated and displayed as Pareto charts in i-Analyzer, enabling you to check the frequency and types of events that occurred over a given period.
This event information is instrumental in quickly prioritizing countermeasures for defects and verifying the effectiveness of equipment upgrades or repairs by monitoring changes in event frequency.
Slide show
i-Board equips a slideshow mode and keeps updating the displayed information.
The slideshow automatically transitions from an overview to more detailed information.
i-Board FAQ (Frequently Asked Questions)
-
Is the license a one-time purchase or a subscription?
-
We offer both plans. The subscription includes maintenance fees and ensures you always have access to the latest version. For one-time purchases (perpetual licenses), you can also access the latest updates by signing a maintenance contract. If you plan to use the software for more than four years, the one-time purchase offers a cost advantage in terms of Total Cost of Ownership (initial cost + operating costs).
-
Are there discounts for purchasing multiple licenses?
-
We offer tiered discounts for purchases of three or more licenses. For orders of 20 or more, a cost-effective corporate license is available. Please contact us via the inquiry form for more details.
-
Does i-Board support cloud or on-premise servers?
-
While i-Board uses a web browser as its user interface, it is compatible with both cloud and on-premise (in-house server) environments.
-
Can i-Board be used on a standard PC?
-
For small-scale data processing, a standard PC* will perform sufficiently well.
*Note: A high-spec PC may be required when handling large volumes of data or numerous characteristics.
-
Can I receive email alerts for quality change points?
-
By installing the optional Alert Manager, you can receive email notifications containing text describing the types and frequencies of alerts. This is useful when the PC is far from the workspace: you can receive summary emails on your smartphone and use the PC only to check details when an anomaly is detected.
-
How does it assist with IATF 16949 "Monitoring and measurement of manufacturing processes (9.1.1.1)"?
-
You can directly record event information, such as equipment repairs or material changes, against specific outliers on the charts. During audits, this allows you to instantly present evidence of "what actions were taken in response to this anomaly" alongside the data plots, significantly reducing the audit compliance workload.
-
Can I monitor the status of the production site in real-time?
-
Yes. Data uploaded through i-Collector or other tools is automatically updated on i-Board according to your pre-set conditions. From a PC on the shop floor, you can continuously monitor both the current "real-time" quality status and historical trends from a fixed point.