

Don’t Just Measure - Monetize Your Quality Data
Transform Precision Measurement into a Lasting Corporate Asset
"We have introduced state-of-the-art high-precision measuring instruments to ensure rigorous quality control."
This familiar phrase often appears on websites and company brochures. For manufacturing enterprises, having high-precision metrology equipment is an important showcase of their commitment to quality.
However, simply purchasing high-performance measuring instruments does not automatically improve product quality.
In actual shop-floor environments, the vast volumes of data generated by these machines are often merely used to generate inspection reports or confirm pass/fail results after the fact, leaving their true potential largely untapped.
In this article, using surface texture (roughness and profile) measuring instruments as an example, we explain how to move beyond treating measurement data as mere historical records and turn it into organizational assets (explicit knowledge) through effective use.
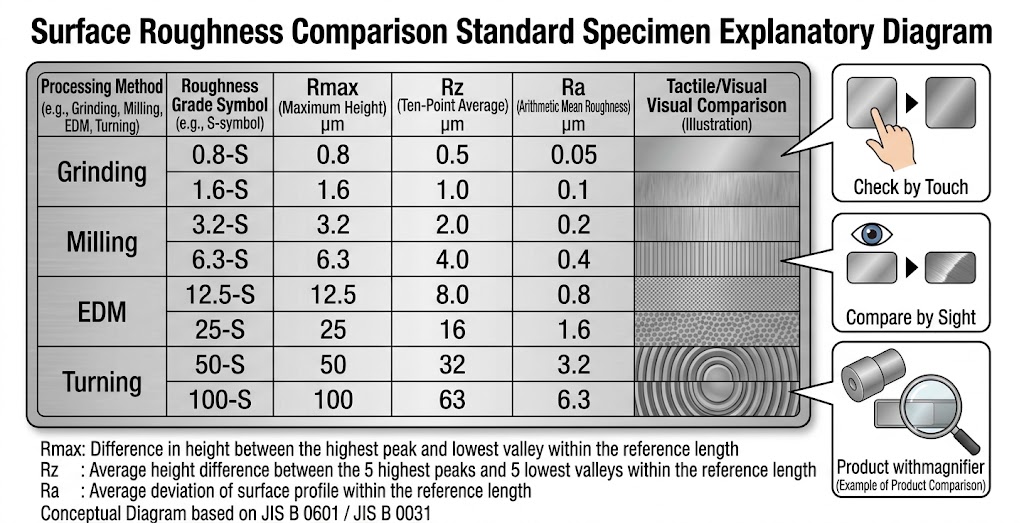
For surface roughness, height (amplitude) parameters such as Ra and Rz (and increasingly Sa and Sz with the shift toward 3D areal parameters) are widely recognized. These parameters generally indicate whether a surface is rough or smooth, with minimal irregularities. A conventional, simple evaluation method is to compare finished parts against roughness-comparison specimens (standard roughness samples) and inspect them visually orby touch.
Because standard specimens indicate reference values using parameters such as Rmax, Ra, and Rz, these height-based parameters naturally became the most commonly adopted metrics for surface roughness.
However, this manual method relies heavily on human tactile and visual perception, making it impossible to evaluate subtle micro-roughness beyond human senses. Today, measuring instruments can trace surfaces using contact styluses or laser beams to capture precise roughness waveforms (profiles). This enables objective evaluations with high consistency and repeatability, while computing a comprehensive range of parameters simultaneously.
With recent advances in high-precision measurement instruments and profile analysis, numerous correlations between surface roughness profiles and surface functionality have been revealed.
For example, in sliding parts where components contact and rub against each other—such as engine cylinder bores and pistons—surface roughness parameters play a critical role.
The ideal cylinder-wall surface is a "plateau structure," consisting of flattened peaks and moderately deep valleys.
If profile peaks are excessively high or too numerous, friction increases and impedes smooth motion. Conversely, if valleys (grooves) are too shallow, they cannot retain enough lubricating oil, increasing the risk of scuffing and seizure. Surface engineering is therefore not simply a matter of making a part completely smooth or rough; intentionally engineering specific surface micro-structures is essential. Try adjusting the Rpk (reduced peak height/spikiness) and Rvk (reduced valley depth) parameters in the interactive simulator below to see how the profile topography changes.
The "Plateau Structure" for Smooth Sliding Surfaces
The ideal surface topography for smooth, hitch-free sliding operation is known as a "plateau structure." In this profile, sharp peaks are leveled off to form flat bearing surfaces, leaving only deep valleys intact.
The plateau tops stably support the load, while the deep recesses retain lubricating oil, preventing excessive friction, wear, and seizure.
Parameters to Prevent Initial Wear and Binding
The average height (volume) of the prominent peaks on the surface. High values mean these peaks will contact the mating material first, causing initial abrasive wear.
The number of peaks that cross a designated slice level (threshold line). While Rpk measures peak height, HSC indicates the density of prominent peaks.
When peak tops are sheared off through processes like plateau honing, peaks exceeding the threshold decrease, causing HSC to drop sharply (or reach zero) alongside reductions in Rpk.
Core and Oil Retention Parameters
The roughness depth of the central core profile that supports operating loads long after initial run-in wear has concluded.
The depth of the lowest profile valleys. These serve as oil reservoirs, sustaining lubricating fluid films and preventing seizure.
Plateau Structure Simulator
As demonstrated, calculated profile parameters provide deep engineering insights, but putting them into practical shop-floor use is far from trivial.
Challenge 1: The Difficulty of Setting Control Thresholds (Tolerance Limits)
While the simulation above shows defined criteria for Rpk and Rvk, manufacturing teams must determine actual acceptable control limits for their specific parts. Identifying optimal threshold boundaries requires cross-referencing endurance test results and defect data against measured parameters through iterative empirical validation. Learning parameter definitions in the classroom is straightforward, but putting them into practice requires accumulated shop-floor data.
Challenge 2: Translating Parameter Changes into Machine Adjustments
The second major hurdle is translating parameter shifts into corrective actions on manufacturing equipment. For grinding operations, this may involve dressing frequency or feed rates; for honing, stroke speed or contact pressure. However, optimum parameters differ across workpieces and materials. Detecting an abnormal parameter is useless if operators lack quantified rules defining exactly what setting to change and by how much to restore nominal conditions.
The Limits of Knowledge Transfer Caused by Relying on Veteran Intuition
Traditionally, complex threshold evaluations and fine equipment adjustments have depended on the intuition and tacit skills of senior machinists. However, relying on individual experience presents severe organizational vulnerabilities:
- Difficulty in Sharing Know-How: Subjective verbal guidance fails to convey precise adjustment magnitudes to junior personnel.
- Loss of Institutional Knowledge: Valuable know-how accumulated over decades disappears as senior staff retire or change roles.
While our iNDEQS platform incorporates AI-driven analytics, quantifying expert rules and machinist instincts delivers far higher and more reliable returns than blindly searching for parameter correlations with AI.
Organizations should not rush to buy new measurement systems or adopt costly AI agents; they can evaluate those in due course.
The top priority is to establish decision criteria and codify operational expertise as explicit institutional knowledge before veteran technicians retire.
Is Excel Evil? The Real Issue Is Shifting from Isolated Data Points to Trendlines
Modern metrology equipment calculates dozens of parameters automatically from a single profile trace.
However, when measurement outputs are stored in disconnected Excel sheets, continuous long-term process trends remain invisible. The critical shift is moving from "point management" (isolated inspection events) to "line management" (continuous time-series analysis). Even with expensive metrology suites, managing data in isolated points yields virtually no added value over static spreadsheets and PDFs.
Furthermore, simply keeping numerical measurement values in a database is insufficient.
If quality data is disconnected from its manufacturing context—namely who produced the part, when, on which machine, and under what specific operating conditions—identifying root causes when defects emerge becomes nearly impossible. Quality data multiplies in value only when managed as a continuous trajectory enriched with full manufacturing context.
Three Key Strategies to Convert Quality Data into an Explicit Asset
To maximize the return on high-precision metrology investments and transform quality control into a competitive advantage, manufacturers should adopt three key practices:
- Correlate Quality Parameters with Machining Conditions to Quantify Adjustment Values
To convert individual expertise into an organizational asset, companies must identify which machine settings correlate with specific measurement parameters and quantify exact correction ratios. Replacing subjective adjustments with quantified guidelines enables repeatable, standardized operating procedures that anyone can execute. - Store Quality Results Along with 5M Manufacturing Conditions to Enable Predictive Quality
Continuously record measured quality values alongside the 5M production conditions (Man, Machine, Material, Method, and Measurement) that produced them. Having a structured history connecting specific process inputs to achieved quality enables production teams to anticipate defect risks, identify bottlenecks, and optimize parameters before producing similar new parts. - Build an Automated Daily Analytics Foundation for Rapid Incident Response
Conducting isolated data analyses only when non-conformances arise does not produce reusable know-how. You can recognize defects quickly only when you understand normal baseline behavior. Establishing automated daily aggregation and analytics platforms allows instant backtracking to root causes during anomalies.
Moreover, when quality improvements plateau, R&D engineering can use accumulated production data to design solutions and validate them within routine production workflows, significantly accelerating PDCA cycle speeds.
Summary: Transforming Metrology from Inspection Checks to Knowledge Capture
The core precision of a measuring instrument reflects the metrology vendor's engineering expertise; competitors can match that accuracy by buying identical hardware. However, production engineering that turns that data into actionable insights can't be duplicated simply by buying equipment. The operational patterns and trends identified in measurement data are unique proprietary know-how tailored to your specific facility and process setup.
High-precision measuring instruments are more than tools to verify whether dimensions meet drawings; their true value lies in serving as high-fidelity input devices that capture knowledge to build corporate-wide explicit assets.
Process Arts develops the iNDEQS software suite not merely to generate standard statistical summaries, but to provide actionable shop-floor intelligence that directly answers: "What specific machine settings should be adjusted to resolve this issue?"
Consult with our team on building a structured quality know-how repository using iNDEQS below:
To explore iNDEQS technical capabilities in greater detail, download our documentation here: