
Pragmatic AI specialized for manufacturing
Auto Tune AI: Moving beyond 'What' to answer 'How'.
Even if correlation analysis or machine learning reveals "what the cause is (What)", it cannot generate specific work instructions for the shop floor.
By simply providing the target tolerance (USL - LSL) and nominal value, AutoTune AI
reverse-calculates with a single click the specific recipe for "how production conditions should be adjusted (How)" that maximizes yield and the process capability index (Cpk).
CHALLENGES
Can your AI truly improve processes?
Issue 01
You know "what works" but not "how much to adjust".
General AI and multiple regression analysis will tell you that "temperature and blend amount affect quality (What)", but they will not answer "specifically which parameters, in what order, and by how much they should be increased or decreased to hit the center of the tolerance (How)".
Issue 02
Failing in mass production by imitating past "coincidentally good conditions".
Even if the "conditions that were closest to the target value in the past" identified through decision tree analysis or similar methods are applied directly on the shop floor, minor environmental fluctuations will often cause out-of-tolerance events. Rather than seeking a point-optimal solution, it is essential to design surface conditions that suppress variation (standard deviation).
Issue 03
Concern about the risks of suddenly applying AI recommendations to the production line.
Directly feeding AI-generated recommended values into mass-production machines poses a serious risk to the shop floor. A Design of Experiments (DoE) mechanism is needed to filter out extreme outliers and validate the values through a small number of tests before adopting them in production.
SOLUTION
A "reverse-calculation AI" that optimizes the shared language of quality assurance: process capability and yield
AutoTune AI learns the nonlinear causal relationship between manufacturing conditions (input parameter groups) and inspection results (quality data), then automatically identifies the "sweet spot that minimizes variation while bringing the results precisely to the center of the tolerance (nominal value)."
No data scientists required. Shop floor engineers can access the "recipe" with a single click
Just specify the target specification values (USL / LSL / Nominal value) from the data accumulated in the daily quality management database (iNDEQS). The AI instantly calculates the specific recommended change amounts (+/-) from the current settings, along with the post-adjustment predicted Cpk and yield improvement margin.
Instruction for recommended actions
Order and adjustment amount (Δ)
Quantify what to adjust and by how much
Process Capability Simulation
Process capability prediction
Compare distribution and yield (%) before and after changes
Safe Shop Floor Introduction
DoE Generation
Automatically generate confirmation test conditions (Design of Experiments) before applying them in production.
【Case Study】 Identical data. Vastly different conclusions.
This is a comparative verification using actual measured open data (N = 1,030 cases).
We will find the parameters (conditions) that control "compressive strength" from the concrete mix conditions (8 items including cement, water, blast furnace slag, curing age, etc.).
[Target Setting] Nominal value: 30.0 MPa / Specification range (LSL~USL): 24.0 ~ 36.0 MPa
General machine learning (Decision Tree / Random Forest)
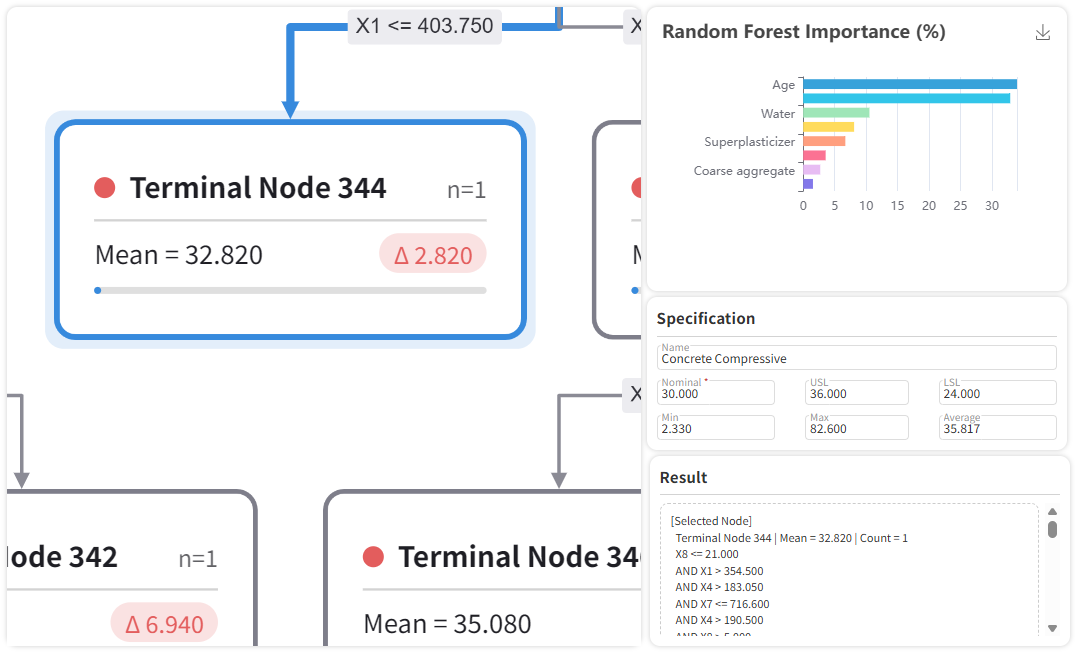
iNDEQS AutoTune AI Analysis Screen
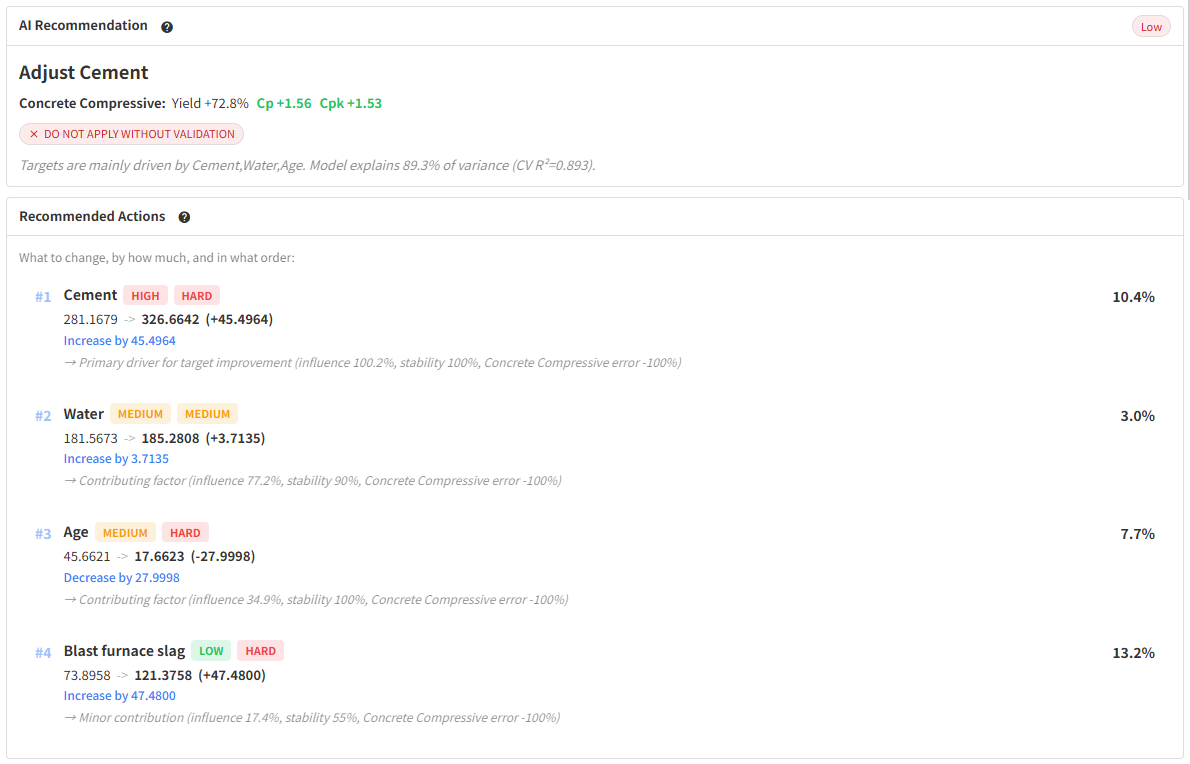
| Comparison Item | General Machine Learning (Decision Tree / Random Forest) | iNDEQS AutoTune AI |
|---|---|---|
| Role of AI | Explanation of What (what the cause is) Searches for variables that explain the variation in the entire data (2.3 - 82.6 MPa) (Explanation of past phenomena). |
Recipe for How (how it should be adjusted) Searches for variables that are highly sensitive and can be stably controlled near the target tolerance (24 - 36 MPa) (Future condition design). |
| Top Important Factors (Key Drivers) |
1st: Age/Curing period (Importance approx. 34%) 2nd: Cement (Importance approx. 33%) * The self-evident overall trend that "strength differs between 1 day and 365 days of curing" comes to the top. |
1st: Cement (Impact 100.2% / Stability 100%) 2nd: Water (Impact 77.2% / Stability 90%) * Automatically excludes extreme long-term curing data exceeding 180 days (33 cases) and identifies main components that can be reliably adjusted around 30 MPa. |
| Specific Shop Floor Instructions / Output |
Extraction of single nodes that were around 30 MPa in the past Because it presents a conditional expression for only "n = 1 case" of applicable data, reproducibility and stability during mass production application are low. |
Presents specific change amounts (Δ) to minimize variation #1 Cement: 281.2 → 326.7 kg (+45.5 Increase) #2 Water: 181.6 → 185.3 kg (+3.7 Increase) #3 Age: 45.7 → 17.7 Days (-28.0 Decrease) #4 Blast furnace slag: 73.9 → 121.4 kg (+47.5 Increase) |
| Quality / Process Capability Improvement Simulation |
No prediction function for process capability indices (Cp / Cpk) or yield. |
- Predicted Output: 30.09 MPa (Error +0.32% against nominal value 30.0 MPa) - Yield: 26.9% → 99.7% (+72.8%p Improvement) - Process Capability: Cp 0.12 → 1.68 / Cpk 0.00 → 1.53 |
If the goal was simply to lower the strength from the overall average (35.8 MPa) to the target (30.0 MPa), decreasing cement would be intuitive. However, AutoTune AI detected the nonlinear risk that "regions with little cement or overly long curing periods see a dramatic increase in strength variation (standard deviation)". By "adding sufficient cement and slag to stabilize the reaction, slightly increasing the water amount, and standardizing the shipping age to about 18 days," it derived a realistic mix recipe that compresses the standard deviation from 16.71 to 1.19.
4 core functions that complete shop floor quality improvement
Automatic Feature Selection (Auto K) and Sensitivity / Stability Evaluation
Automatically extracts the top factors (Auto K) that truly work from numerous manufacturing parameters. It evaluates not only the "impact (%)" of each factor but also its "characteristic stability (%)" and "difficulty of change," clearly indicating the priority of the knobs to be turned.
Intelligent Risk Assessment & Automatic Outlier Exclusion
Automatically detects isolated data (anomalous values / test conditions) outside the normal operating range, limiting the analysis scope (DoE Window) to the actual operating data group. It also warns of process bias (drift) in the first and second halves of the data and discrepancies between models.
Before / After Process Capability (Cp / Cpk) Prediction
Simulates the quality distribution after applying recommended actions and quantifies the improvement margin of the average value, standard deviation, yield (%), Cp, and Cpk. The numerical evidence necessary for proposals and approvals when changing production conditions is readily available.
Automatic Generation of "Design of Experiments (DoE)" Before Production Application
Based on the safety philosophy of "do not apply to production without verification," AutoTune AI automatically generates a test condition list and predicted values for each test run to efficiently confirm the surroundings (low, center, high) of the AI-recommended values. You can input the actual measured values directly into the screen for verification.
Stop guessing. Let our AI prescribe the 'How' using your actual shop floor data.
You can test AutoTune AI in our public cloud demo environment.
We also offer trial analyses using your company's actual data (CSV or Excel) and one-on-one demonstrations.